
Some implementation details (before the fun stuff)
To be honest, the implementation has been quite easy, and there is really nothing new or special: just a bunch of scripts to collect the data and some basic Pandas transformations. The only parts that might be worth highlighting, are the interaction with the Google APIs and the estimation of the time the property spent on the market.
Data below are not coming from scraping, and have been generated using this script.
Let’s have a look at the raw data:

As I anticipated, the file contains the following columns:
-
id: An identifier for the listing -
_address: The address of the property -
_d_code: The Dublin Area Code. Each Dublin area is identified by a code in the formatD<number>. When the<number>is even, the address is located on the south of the Liffey (the river that cuts the city), while if the number is odd, the address is located on the north side of the river. -
_link: The link to the original page where the listing has been retrieved. -
_price: The property asking price in Euro. -
type: The property type (HOUSES,APARTMENTS,NEW HOUSES). -
_bedrooms: Number of bedrooms. -
_bathrooms: Number of bathrooms. -
_ber_code: A code that identifies the energy rating, the closer to the letter A, the better the energy rating. -
_views: The views obtained by the listing (if available). -
_latest_update: When the listing has been updated or created (if available). -
days_listed: This is a calculated field and it’s the difference between the date I collected the data and the_last_updatecolumn.
Address geocoding
The idea is to put this stuff on a map and enable the power of geolocalized data. To do so, let’s see how to get latitude and longitude using Google API.
If you want to try this, you’ll need a Google Cloud Platform account and you may want to follow the guide to get an API key and to enable the appropriate API. As I wrote earlier, for this project I used the Geocoding APIs, the Directions API, and the Places API (so you will need to enable these specific API when you create the API key). Below the snippet to interact with the Cloud platform.
Estimating the time-on-market
Let’s focus on the data below:
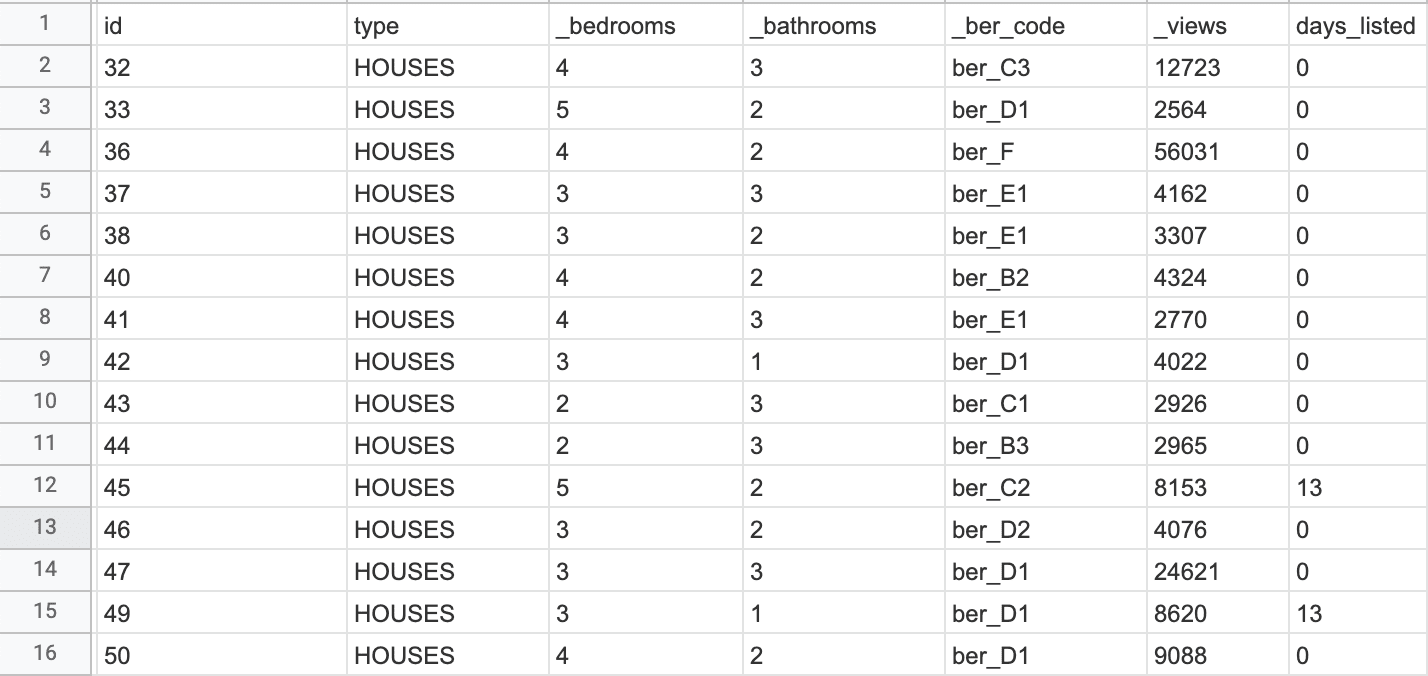
As you can see in this sample, the number of views associated with the properties are not reflected in the number of days the listing has been live: for example the house with id=47 has ~25k views, but apparently has been listed the exact date I downloaded the data.
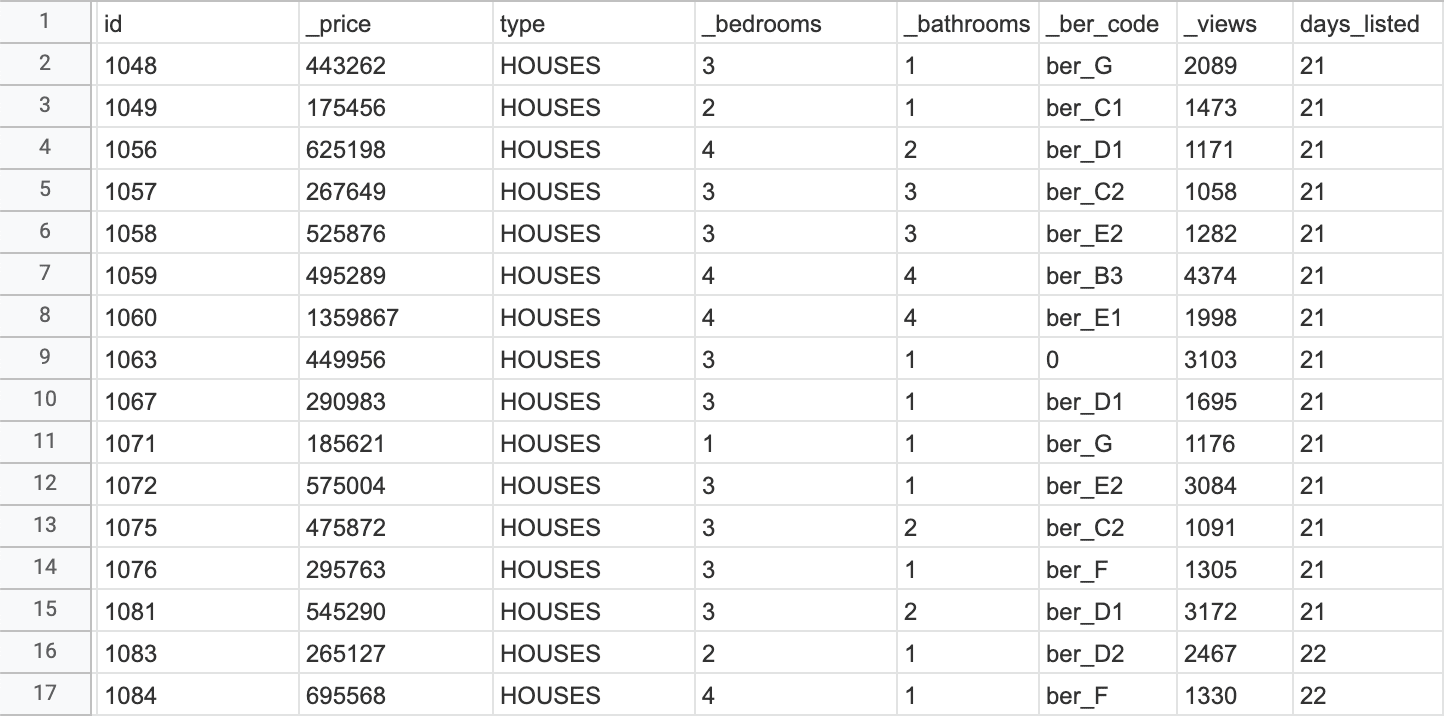
This issue is not present for all the properties, though; in the sample below, the number of views is more consistent with the days listed:
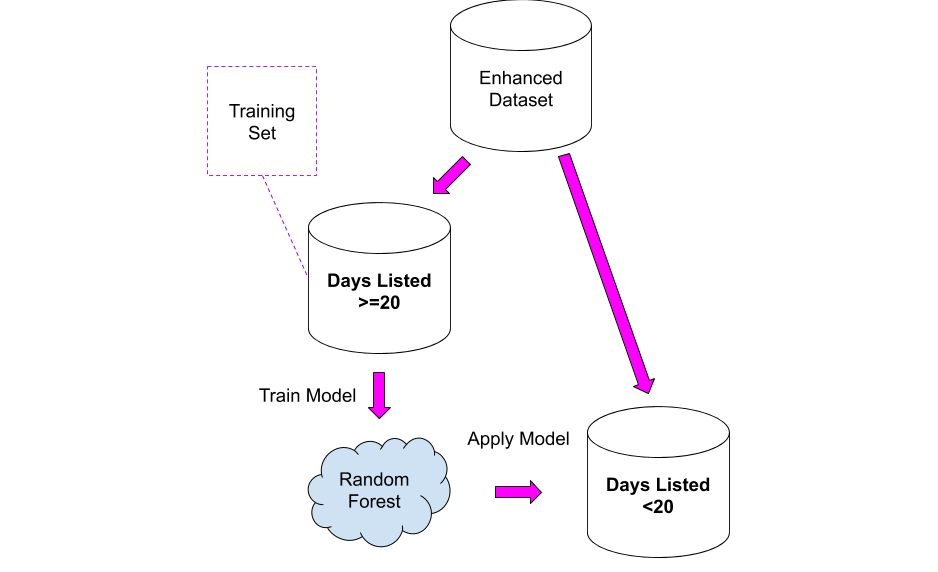
How can we exploit the knowledge above? Easy: we can use the second dataset as the training set for a model, that then we can apply to the first dataset!
I tried two approaches:
- Take the “consistent” dataset and calculate the average views per day, I then applied that average to the “unknown” dataset. This solution is not completely unreasonable, but it has the problem that all the houses are placed in the same bucket: it is likely that a house worth 10M Euro could have fewer views per day, as that budget is reserved for a small niche of people.
- Training a Random Forest model on the second dataset and apply it to the first.
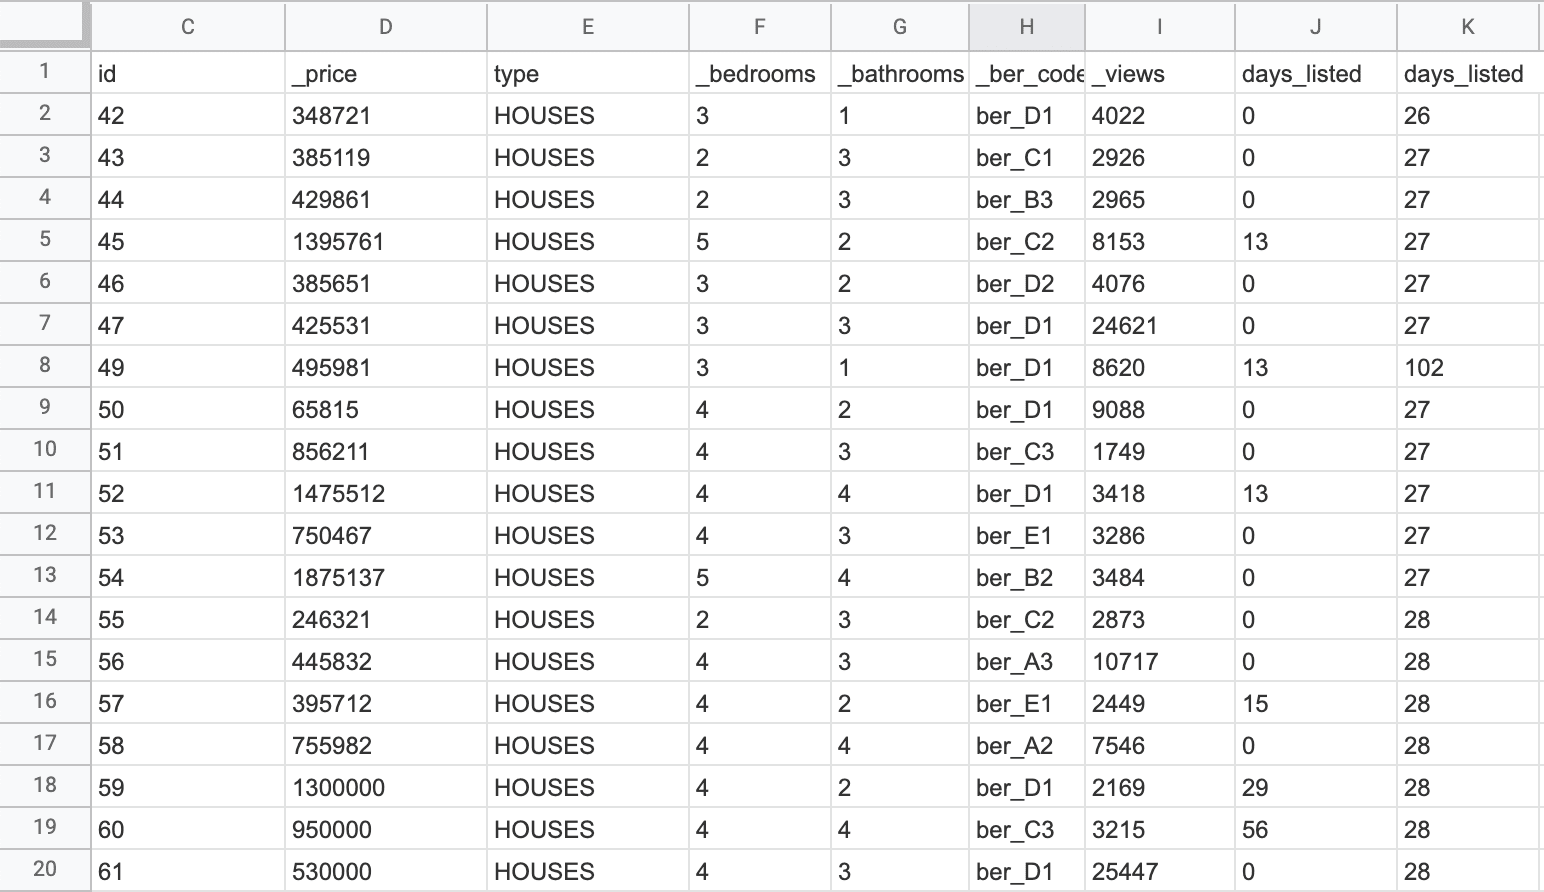
The results need to be read very carefully, knowing that the new column will be a rough approximation of the real values: I used them as a starting point for digging a bit more on properties where something seemed odd.
The analysis
Ladies and Gentlemen: the final dashboard. If you want to play around with it just follow this link.
Note: Google Data Studio would allow embedding reports on Medium (as you can see in this other article I wrote). Unfortunately the Google Maps module does not work when embedding in an article, so I needed to fall back to screenshots.